
Martinez E. CID 2015;60:811-20 ; Saumoy M. J AntimicrobChemother 2015;70:1130-8
Type of ARV Trial
Head-to-head comparative trials for first line ART since 2006
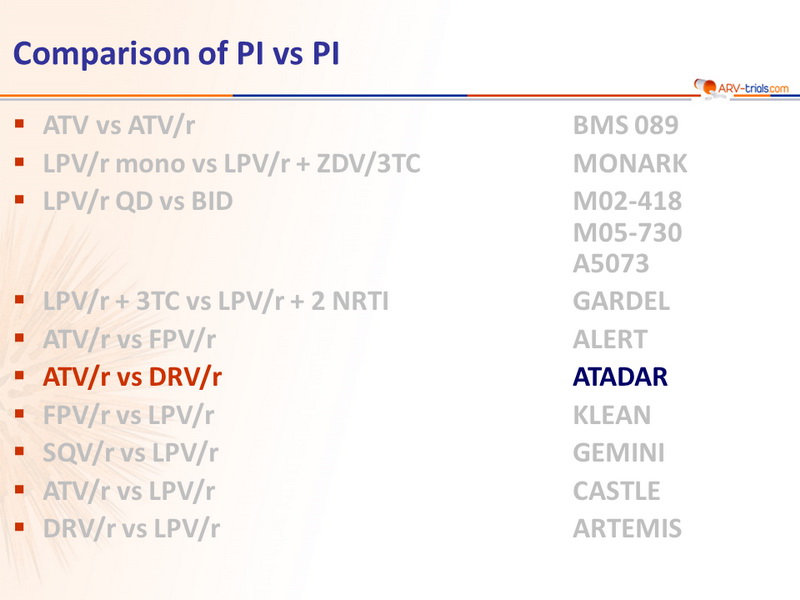
» PI vs PI
» ATV/r + FTC/TDF vs DRV/r + FTC/TDF
Head-to-head comparative trials for first line ART since 2006
» PI vs PI
» ATV/r + FTC/TDF vs DRV/r + FTC/TDF
Drugs
DRV/r, ATV/r, FTC/TDF, TDF, FTC
DRV/r, ATV/r, FTC/TDF, TDF, FTC


- No major differences between ATV/r + TDF/FTC and DRV/r
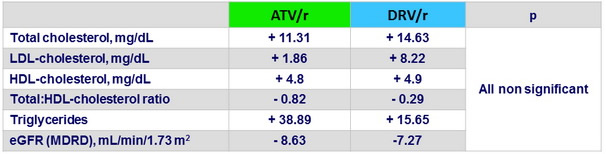
+ TDF/FTC in efficacy, clinically relevant side effects, or plasma cholesterol fractions, over 96 weeks - However, ATV/r led to higher triglycerides and more total and subcutaneous fat than DRV/r
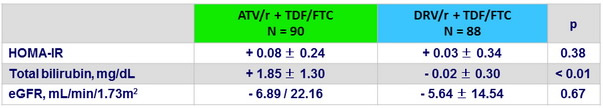
- Fat gains with ATV/r were associated with insulin resistance
- In contrast with what occurred in the ATV/r arm, the LDL subfraction phenotype improved with DRV/r at W48. This difference was associated with a lower impact on plasma triglycerides with DRV/r
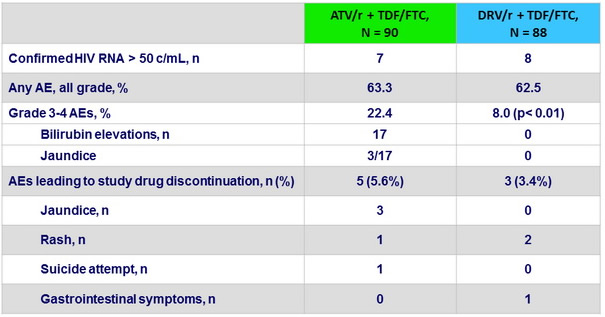
- Most Grade 3-4 AE were due to hyperbilirubinemia, in the ATV/r arm
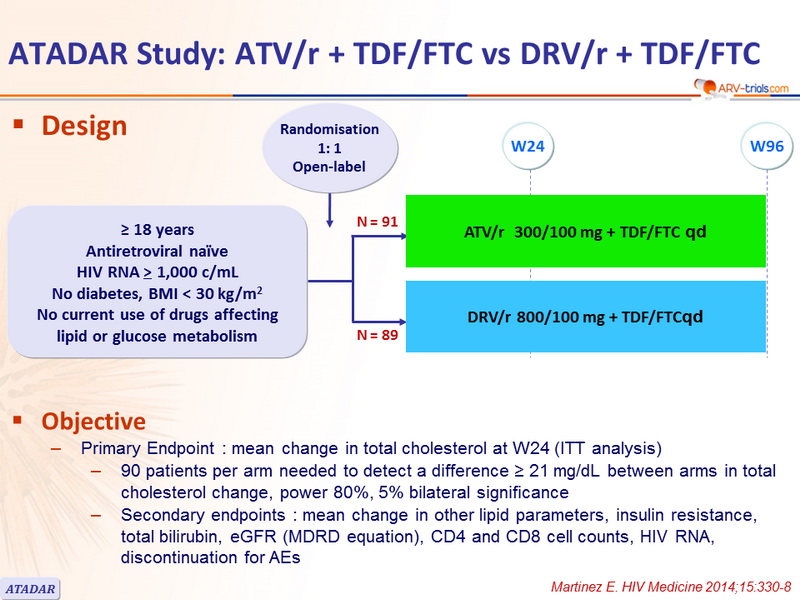
Design
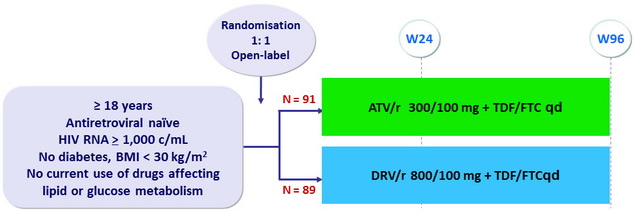
Objective
- Primary Endpoint : mean change in total cholesterol at W24 (ITT analysis)
- 90 patients per arm needed to detect a difference ≥ 21 mg/ dL between arms in total cholesterol change, power 80%, 5% bilateral significance
- Secondary endpoints : mean change in other lipid parameters, insulin resistance, total bilirubin, eGFR (MDRD equation), CD4 and CD8 cell counts, HIV RNA, discontinuation for AEs
Baseline characteristics and disposition
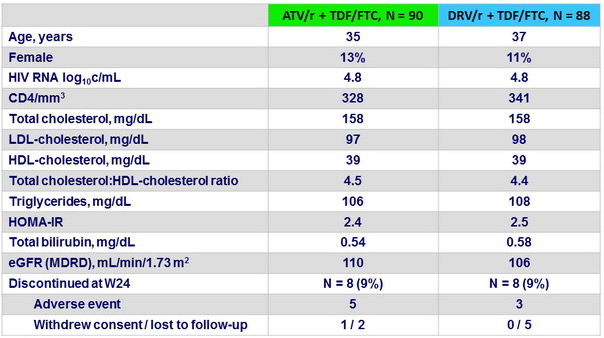
Data expressed as mean
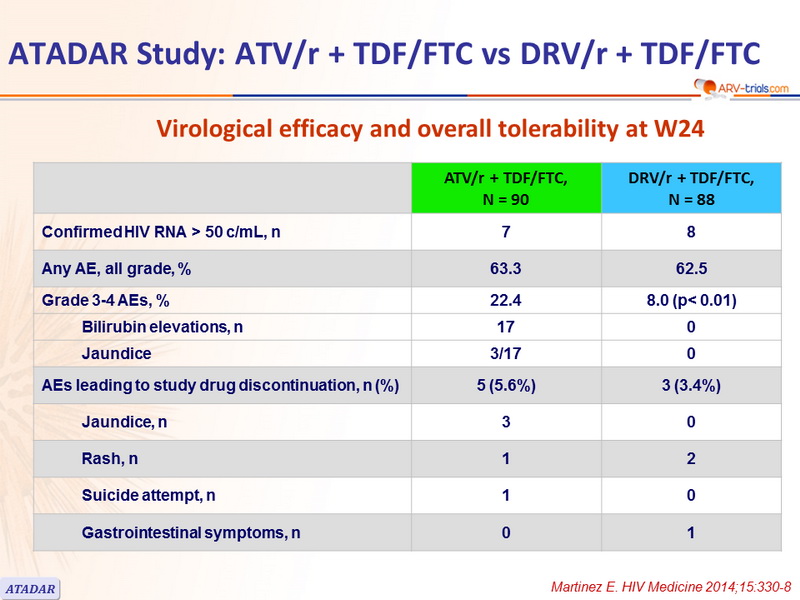
Virological efficacy and overall tolerability at W24
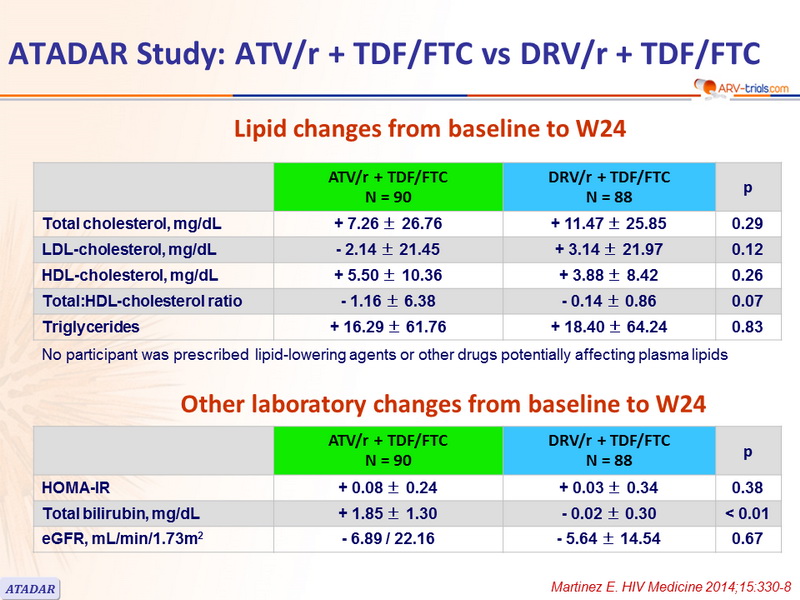
Lipid changes from baseline to W24
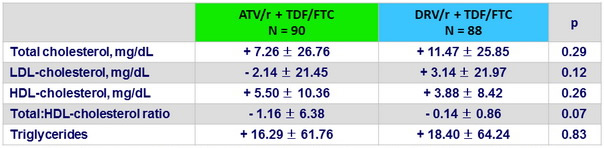
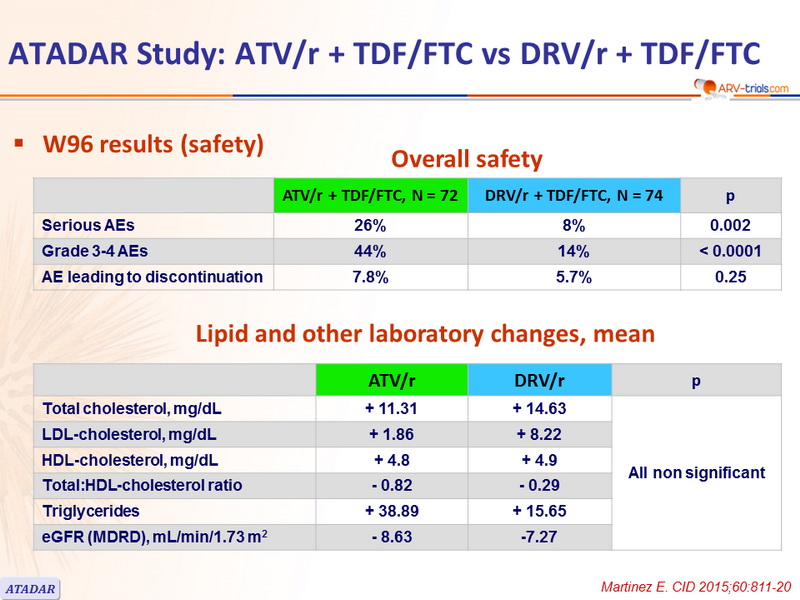
No participant was prescribed lipid-lowering agents or other drugs potentially affecting plasma lipids
Other laboratory changes from baseline to W24
Metabolic sub-study in 86 participants (ATV/r = 45, DRV/r = 41)
- LDL subfraction phenotype and Lp-PLA2 at W48, Framingham risk score change. Patients a ssessed at W48 : 40/45 and 37/41
- LDL subfraction phenotype : predominance of the more favorable phenotype at baseline (around 75% of participants)
- ATV/r : i ncrease in cholesterol content in small and dense LDL particles, associated with coronary artery disease risk (p = 0.015) at W48
- DRV/r : increase in LDL size (p = 0.017) and large LDL particles (p = 0.008) (improved atherogenic properties) at W48
- No change in total Lp-PLA2 activity and no shift in its relative distribution in LDL or HDL particles at W48, with no differences between arms
- Framingham score very low at baseline (1%) with no changes at W48
- Insulin increased only in the ATV/r group (p = 0.017), but HOMA-IR showed no changes in either arm at W48
- BMI increased in the ATV/r arm (+1.01 kg/m 2 at W48, p = 0.004) [p= 0.06 vs DRV/r]
- Waist increased in the DRV/r arm (+ 3 cm at W48, p < 0.001) [p = 0.027 vs ATV/r]
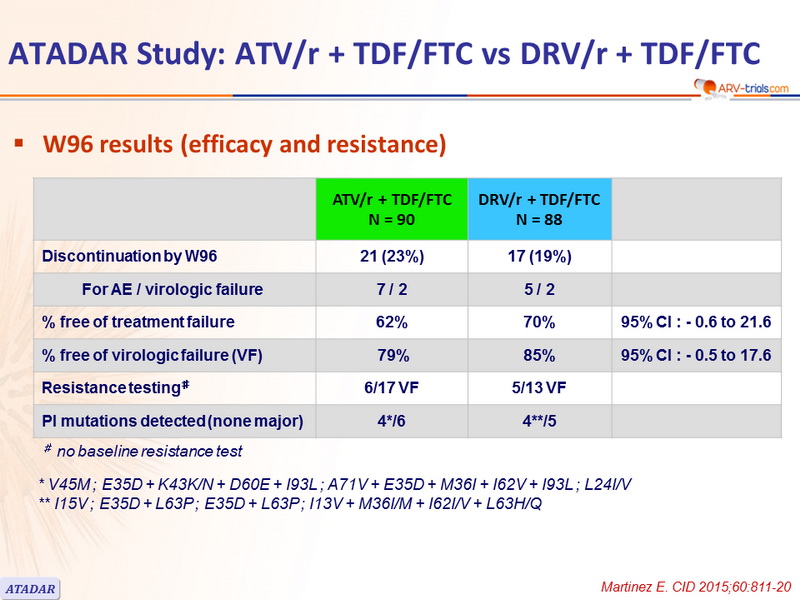
W96 results (efficacy and resistance)
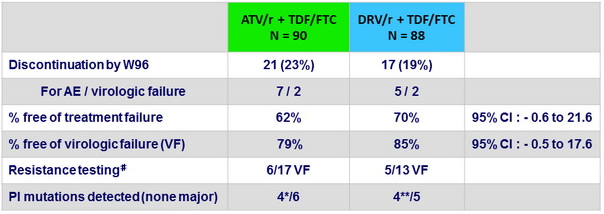
♯ no baseline resistance test
* V45M ; E35D + K43K/N + D60E + I93L ; A71V + E35D + M36I + I62V + I93L ; L24I/V
** I15V ; E35D + L63P ; E35D + L63P ; I13V + M36I/M + I62I/V + L63H/Q
W96 results: Overall safety

Lipid and other laboratory changes, mean
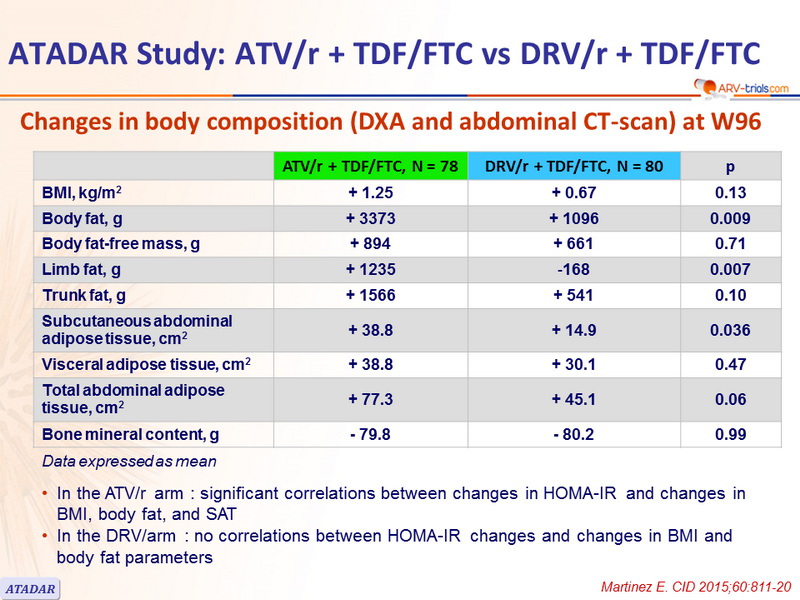
Changes in body composition (DXA and abdominal CT-scan) at W96
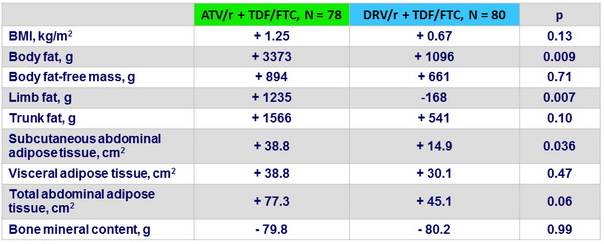
Data expressed as mean
- In the ATV/ r arm : significant correlations between changes in HOMA-IR and changes in BMI, body fat, and SAT
- In the DRV/arm : no correlations between HOMA-IR changes and changes in BMI and body fat parameters